Fig. 10
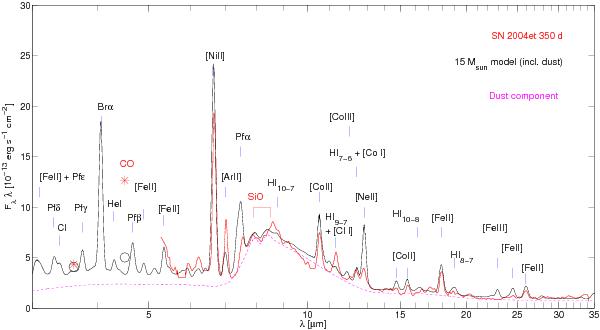
Observed MIR spectrum at 350 days (red, solid line), compared to model spectra of the 15 M⊙ model (black, solid). To simulate the instrument response, the model has been convolved with a Gaussian of FWHM = λ/R, where the resolving power R was taken to be 60. Also shown are the dust component (pink, dashed), the observed photometry at 3.6 and 4.5 μm (red stars), and the corresponding model photometry for the model (black circles). The observed photometry is at 361 days, and has been rescaled with the 56Co decay factor to 350 days (exp−11/111.5).
Current usage metrics show cumulative count of Article Views (full-text article views including HTML views, PDF and ePub downloads, according to the available data) and Abstracts Views on Vision4Press platform.
Data correspond to usage on the plateform after 2015. The current usage metrics is available 48-96 hours after online publication and is updated daily on week days.
Initial download of the metrics may take a while.