Free Access
Fig. 1
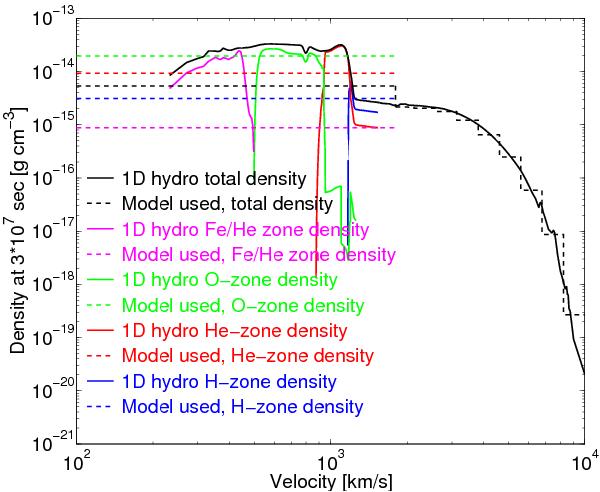
The density profile in the 1D hydrodynamical model (solid lines) and in the artificially mixed model used in this paper (dashed lines). Note that in the artificially mixed model, the zones in the core are distributed as clumps with individual filling factors, the densities plotted are the densities within each clump.
Current usage metrics show cumulative count of Article Views (full-text article views including HTML views, PDF and ePub downloads, according to the available data) and Abstracts Views on Vision4Press platform.
Data correspond to usage on the plateform after 2015. The current usage metrics is available 48-96 hours after online publication and is updated daily on week days.
Initial download of the metrics may take a while.