Fig. 6
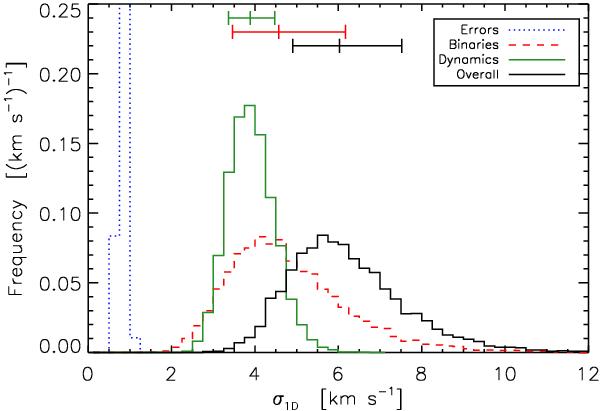
Estimate of the line-of-sight velocity dispersion distribution for massive stars in the inner 5 pc of R136. The blue dotted curve shows the contribution of measurement errors. The red dashed curve is the distribution from binaries undetected after applying our variability criteria (the initial input population has a binary fraction of 100%, and an Öpik-law distribution of the periods is adopted with period range of 0.15−6.85 in log P with P in units of days). The green solid curve is the dynamical velocity dispersion which best reproduces the observed velocity dispersion. The black solid curve takes into account measurement errors, undetected binaries, and the dynamical velocity dispersion. The median (central tick) and 68% confidence interval (equivalent to ± 1 σ for Gaussian distributions) of the distributions are indicated on the upper part of the graph.
Current usage metrics show cumulative count of Article Views (full-text article views including HTML views, PDF and ePub downloads, according to the available data) and Abstracts Views on Vision4Press platform.
Data correspond to usage on the plateform after 2015. The current usage metrics is available 48-96 hours after online publication and is updated daily on week days.
Initial download of the metrics may take a while.