Fig. 4
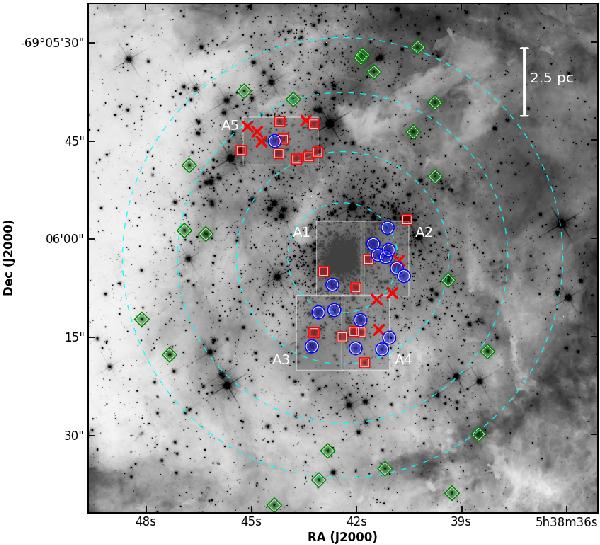
Distribution of ARGUS and Medusa sources used in this work overlaid on an F555W HST-WFC3 image. ARGUS stars in which no variability was detected are shown with blue circles, ARGUS variable stars are represented by red squares, and ARGUS stars with too low S/N for RV analysis or no suitable absorption lines are indicated by red crosses. The ARGUS IFU pointings (A1 to A5) are also shown as grey transparent rectangles. Medusa non-variable stars added to the sample are represented by green diamonds. The dashed circles indicate projected radial distances of 2, 4, 6, and 8 pc from the centre of R136.
Current usage metrics show cumulative count of Article Views (full-text article views including HTML views, PDF and ePub downloads, according to the available data) and Abstracts Views on Vision4Press platform.
Data correspond to usage on the plateform after 2015. The current usage metrics is available 48-96 hours after online publication and is updated daily on week days.
Initial download of the metrics may take a while.