Fig. 3
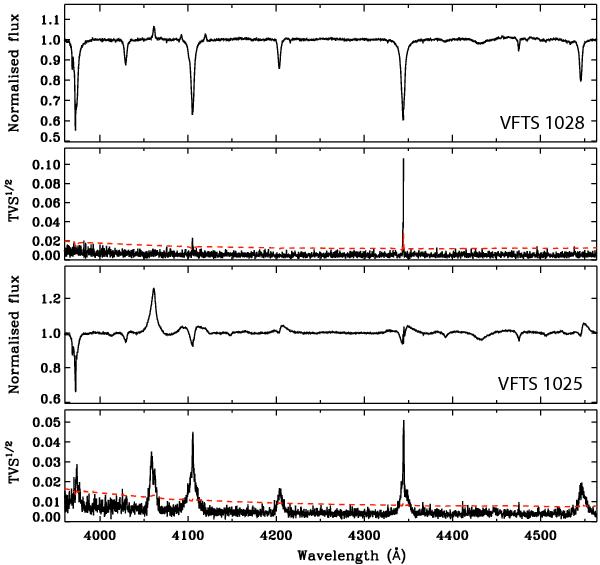
Weighted mean spectrum (first and third panels from the top) and Temporal Variance Spectrum (TVS1/2; second and fourth panels from the top) for the ARGUS sources VFTS 1028 and VFTS 1025. The red dashed curves indicate the 99% confidence level for variability. Significant variability is only seen in the nebular emission lines of VFTS 1028, but it is detected in several stellar lines in VFTS 1025.
Current usage metrics show cumulative count of Article Views (full-text article views including HTML views, PDF and ePub downloads, according to the available data) and Abstracts Views on Vision4Press platform.
Data correspond to usage on the plateform after 2015. The current usage metrics is available 48-96 hours after online publication and is updated daily on week days.
Initial download of the metrics may take a while.