Fig. 11
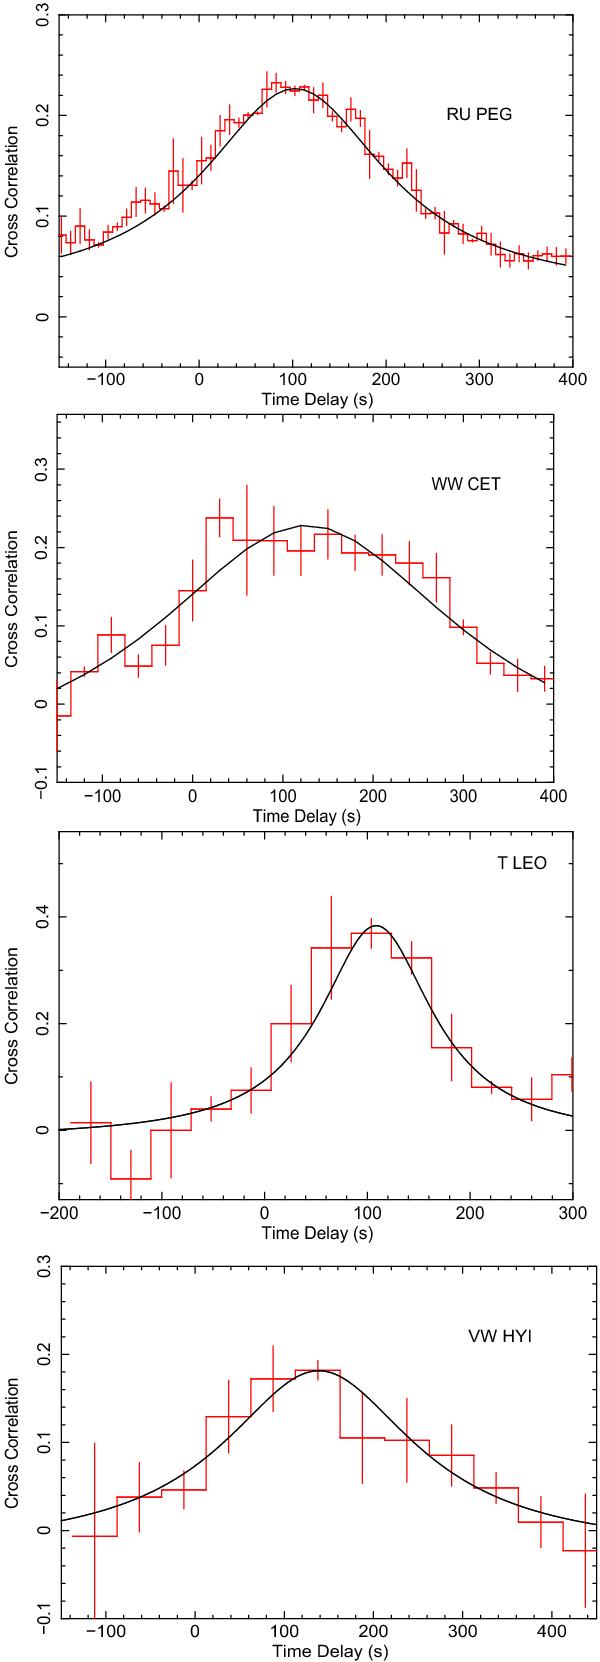
Subtracted cross-correlation of the EPIC pn (X-ray) and OM (UV) light curves (see the text for details). The residuals of the fits to the cross-correlations are displayed for RU Peg, WW Cet, T Leo, and VW Hyi from the top to the bottom of the figure. Single Lorenzian fits applied are shown as solid black lines (SS Cyg has been excluded since only a single Lorentzian was already used). The reduced χ2 values of the fits are given in Table 2.
Current usage metrics show cumulative count of Article Views (full-text article views including HTML views, PDF and ePub downloads, according to the available data) and Abstracts Views on Vision4Press platform.
Data correspond to usage on the plateform after 2015. The current usage metrics is available 48-96 hours after online publication and is updated daily on week days.
Initial download of the metrics may take a while.