Fig. 1
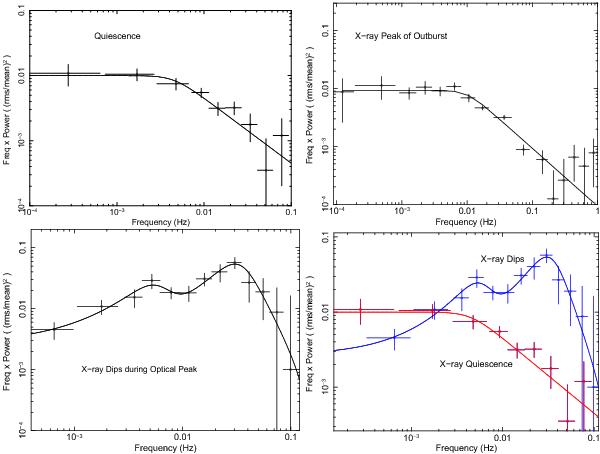
Power spectra of SS Cyg in outburst obtained from a collection of archival RXTE data listed in Table 1. The PDS at different times are ordered as the quiesence on the top lefthand side, the X-ray peak on the top righthand side, and the X-ray dips during the optical peak on the bottom lefthand side. On the bottom righthand side, the PDS of SS Cyg in quiescence and during the X-ray suppression (optical peak) is shown for comparison. The solid lines show the fit with the propagating fluctuations model for the top figures and for the PDS of the X-ray dips two Lorentzians along with the propagating fluctuations model are used to achieve the best fitting results. The reduced χ2 values of the fits are 0.62, 1.5, and 0.4 for the quiescence, the X-ray peak and the X-ray dips, respectively.
Current usage metrics show cumulative count of Article Views (full-text article views including HTML views, PDF and ePub downloads, according to the available data) and Abstracts Views on Vision4Press platform.
Data correspond to usage on the plateform after 2015. The current usage metrics is available 48-96 hours after online publication and is updated daily on week days.
Initial download of the metrics may take a while.