Fig. 2
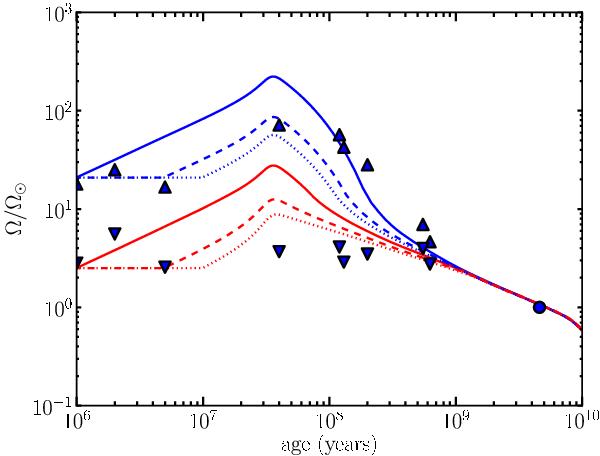
Evolution of the rotation rate for an initially slow (lower red curves) and fast (upper blue curves) rotating solar-mass star, for different disc lifetimes: τd = 1 Myr (solid curves); τd = 5 Myr (dashed curves); τd = 10 Myr (dotted curves). The solar value is indicated by a solid circle. Direct and inverted triangles are observational data compiled in Table 1 of Bouvier (2008) and represent respectively the 10th and 75th percentiles of observed rotational period distribution.
Current usage metrics show cumulative count of Article Views (full-text article views including HTML views, PDF and ePub downloads, according to the available data) and Abstracts Views on Vision4Press platform.
Data correspond to usage on the plateform after 2015. The current usage metrics is available 48-96 hours after online publication and is updated daily on week days.
Initial download of the metrics may take a while.