Fig. 4
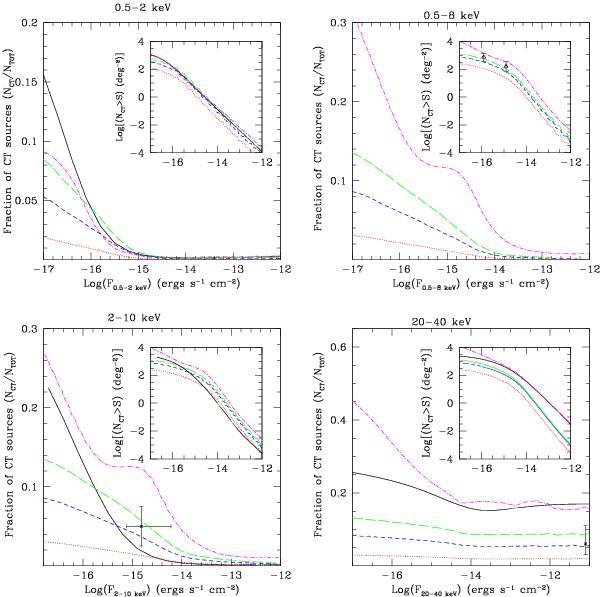
The observed fraction of Compton-thick AGN in the spectral bands 0.5−2, 0.5−8, 2−10 and 20−40 keV. Our model predictions for an intrinsic Compton-thick AGN fraction of 5, 15, 25% correspond to the the red dotted, blue short-dashed and green long dashed curves, respectively. The black solid lines are the predictions of the X-ray background synthesis model of Gilli et al. (2007). The magenta dot-dashed lines are the predictions of the Ballantyne et al. (2011) model. The inset plots show the predictions for the cumulative number counts of Compton-thick AGN. The curves are the same as in the main panels. The observational datapoints are from Tozzi et al. (2006) (2−10 keV), Brightman & Ueda (2012) (0.5−8 keV), Krivonos et al. (2007) adapted from Treister et al. (2009) (20−40 keV).
Current usage metrics show cumulative count of Article Views (full-text article views including HTML views, PDF and ePub downloads, according to the available data) and Abstracts Views on Vision4Press platform.
Data correspond to usage on the plateform after 2015. The current usage metrics is available 48-96 hours after online publication and is updated daily on week days.
Initial download of the metrics may take a while.