Fig. 1
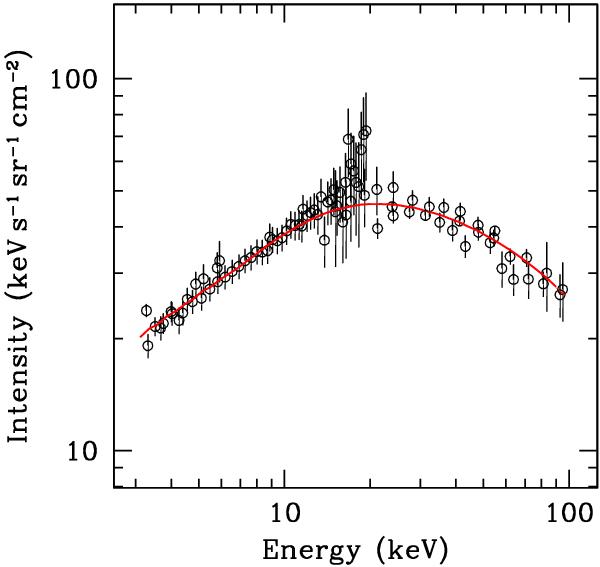
Red curve: an example of an XRB spectrum produced by our synthesis model for parameters Γ = 1.88, EC = 230 keV, fREF = 0.055 and fCT = 0.1. The points are the observational constraints on the intensity of the XRB at different energies from the studies discussed in the text. Comparison of the model curve with the data yields a χ2 of 70.8 for 86 degrees of freedom (90 data points minus four free parameters).
Current usage metrics show cumulative count of Article Views (full-text article views including HTML views, PDF and ePub downloads, according to the available data) and Abstracts Views on Vision4Press platform.
Data correspond to usage on the plateform after 2015. The current usage metrics is available 48-96 hours after online publication and is updated daily on week days.
Initial download of the metrics may take a while.