Free Access
Fig. 3
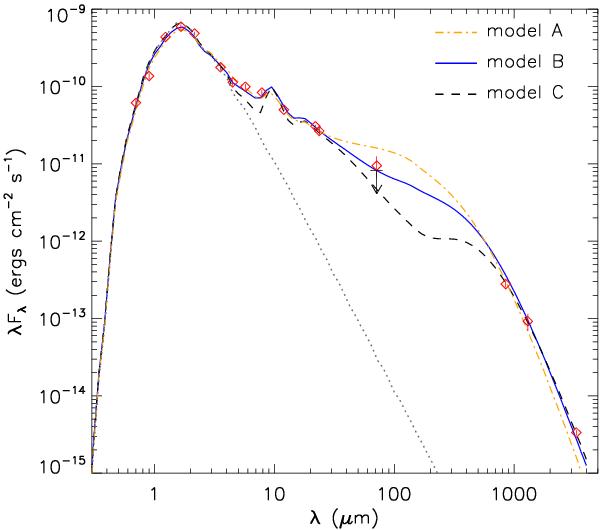
The top three model fits found by SA. The red diamonds depict the photometric measurements and the black arrow represents the upper limit for the 70 μm flux (Cieza et al. 2010). The gray dotted line marks the contribution of the central star to the total flux of the system.
Current usage metrics show cumulative count of Article Views (full-text article views including HTML views, PDF and ePub downloads, according to the available data) and Abstracts Views on Vision4Press platform.
Data correspond to usage on the plateform after 2015. The current usage metrics is available 48-96 hours after online publication and is updated daily on week days.
Initial download of the metrics may take a while.