Fig. 1
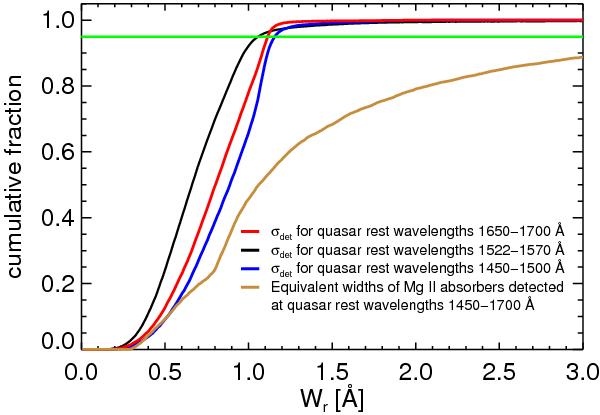
The cumulative distribution of the 3-sigma detection limit, 3σdet, measured for all quasar spectra in our sample, for three quasar rest-frame wavelength intervals; the detection limit is defined in Sect. 2. Only the spectral regions in which we actually searched for absorbers (i.e. those that fulfill our signal-to-noise criterion, see Sect. 2) are included in the cumulative distributions. For comparison, the brown curve shows the cumulative distribution of equivalent widths of Mg ii absorbers detected by our algorithm within the quasar rest-frame wavelength interval 1450–1700 Å. The horizontal green line shows the 95% completeness limit.
Current usage metrics show cumulative count of Article Views (full-text article views including HTML views, PDF and ePub downloads, according to the available data) and Abstracts Views on Vision4Press platform.
Data correspond to usage on the plateform after 2015. The current usage metrics is available 48-96 hours after online publication and is updated daily on week days.
Initial download of the metrics may take a while.