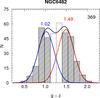
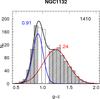
Fig. 8
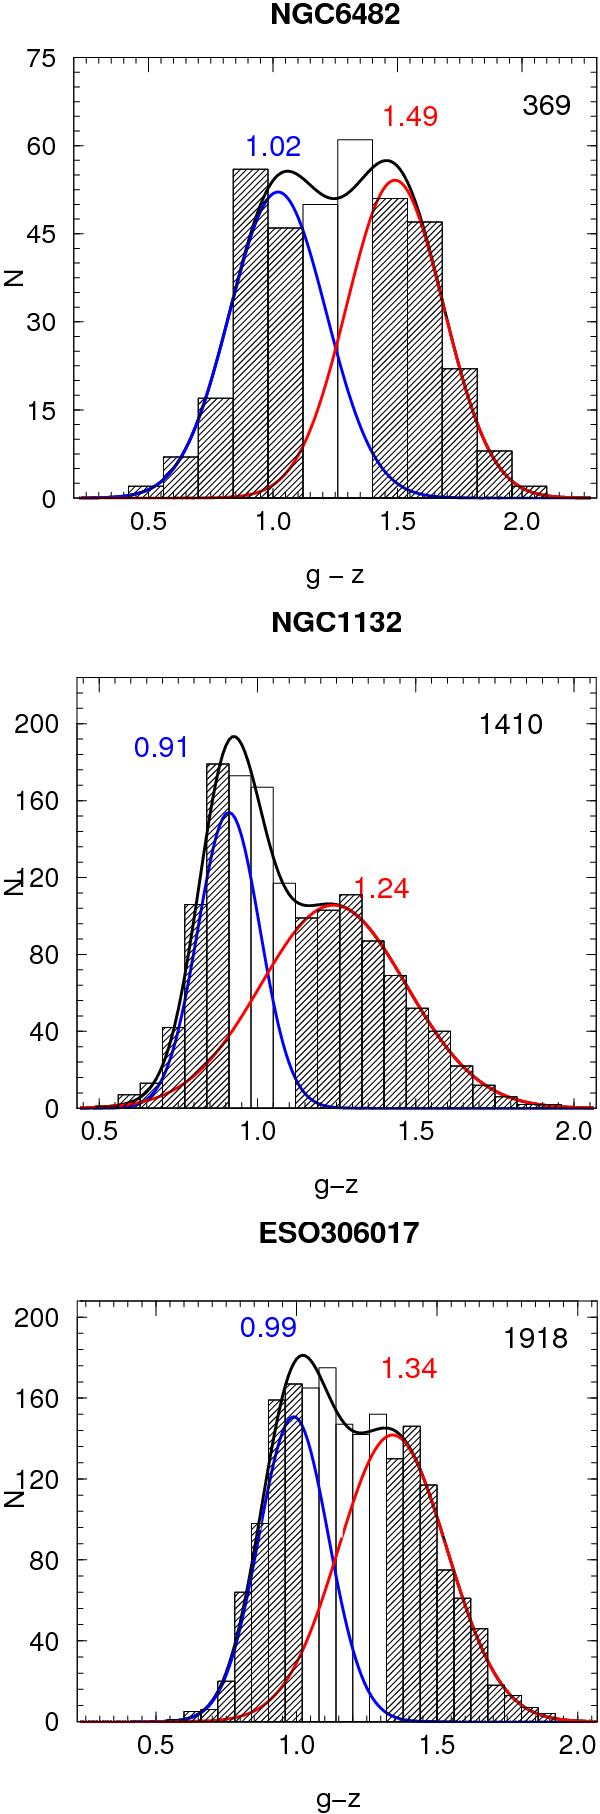
Color histograms with the best GMM two-Gaussian fit. The individual Gaussians with their mean value are indicated with a blue or red number and solid curve; their sum is the black solid line. The hatched areas indicate the objects we include in the blue and red populations. The number of GCs is shown in the upper right of each panel.
Current usage metrics show cumulative count of Article Views (full-text article views including HTML views, PDF and ePub downloads, according to the available data) and Abstracts Views on Vision4Press platform.
Data correspond to usage on the plateform after 2015. The current usage metrics is available 48-96 hours after online publication and is updated daily on week days.
Initial download of the metrics may take a while.