Fig. 7
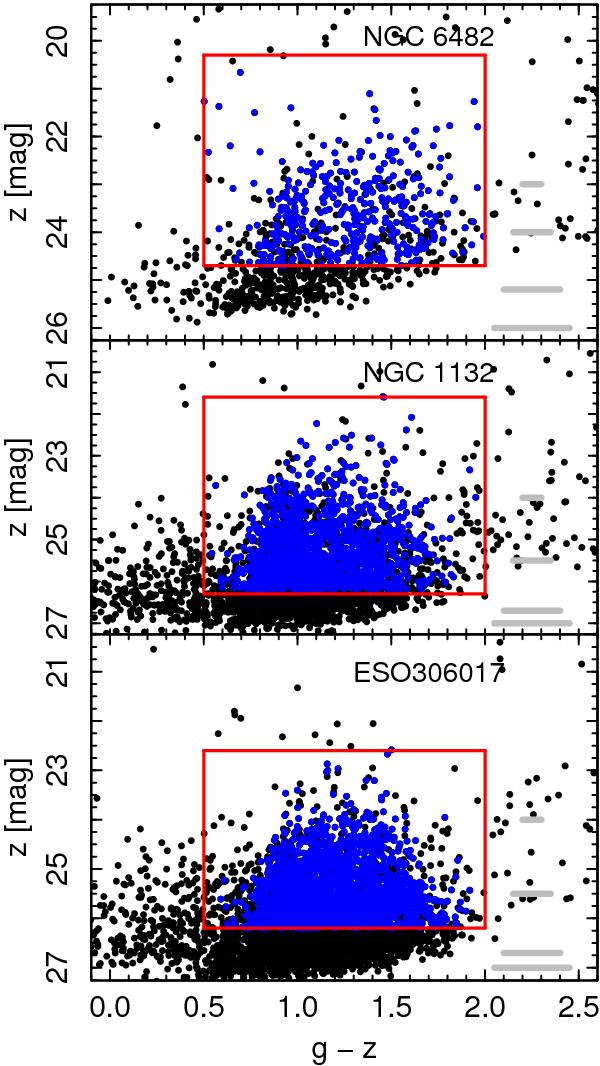
Color–magnitude diagram of objects in the FG fields. The black dots are all the detected objects in the FOV. The thick gray lines show the error bars in color at different magnitudes. The blue dots framed within the red lines are the selected sample of GC candidates with color range 0.5 < g − z < 2.0. The bright magnitude limit is at  ; beyond the faint magnitude limit, there is a dependence of the detection limit on color, and redder objects are missed. Top to bottom: NGC 6482, NGC 1132 and ESO 306-017.
Current usage metrics show cumulative count of Article Views (full-text article views including HTML views, PDF and ePub downloads, according to the available data) and Abstracts Views on Vision4Press platform.
Data correspond to usage on the plateform after 2015. The current usage metrics is available 48-96 hours after online publication and is updated daily on week days.
Initial download of the metrics may take a while.