Free Access
Fig. 13
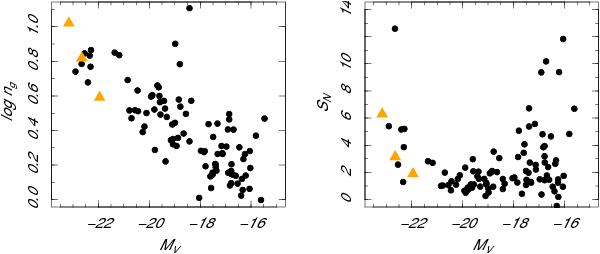
Fossil groups in context: galaxy Sérsic index (left) and SN are plotted as a function of MV for the fossil groups studied here (orange triangles) and the ACS Virgo Cluster Survey galaxies (black circles). The Virgo data are from Ferrarese et al. (2006) and Peng et al. (2008).
Current usage metrics show cumulative count of Article Views (full-text article views including HTML views, PDF and ePub downloads, according to the available data) and Abstracts Views on Vision4Press platform.
Data correspond to usage on the plateform after 2015. The current usage metrics is available 48-96 hours after online publication and is updated daily on week days.
Initial download of the metrics may take a while.