Free Access
Fig. 1
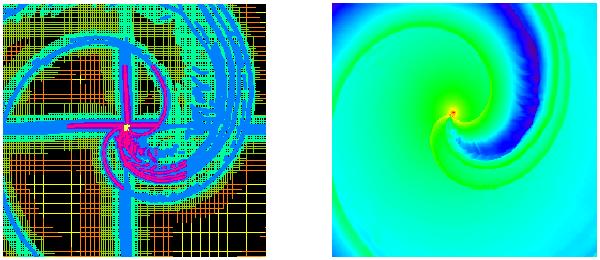
2D simulation of WR104. Left panel: AMR map, the coarse level is lmin = 7 (yellow grid in outer regions), the highest resolution is lmax = 16 (pale yellow at the very center of the grid). Right panel: the density map shows refinement happens at the shocks.
Current usage metrics show cumulative count of Article Views (full-text article views including HTML views, PDF and ePub downloads, according to the available data) and Abstracts Views on Vision4Press platform.
Data correspond to usage on the plateform after 2015. The current usage metrics is available 48-96 hours after online publication and is updated daily on week days.
Initial download of the metrics may take a while.