Fig. 9
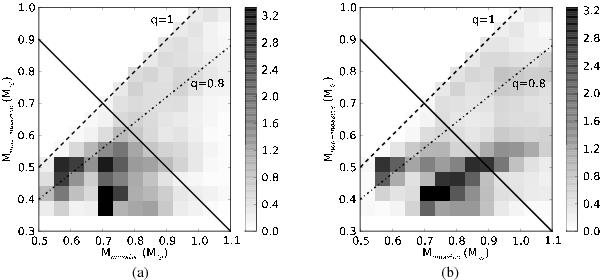
Simulated population of merging double CO white dwarfs from a single burst of star formation as a function of the masses of the two white dwarfs. Mmassive is the mass of the most massive white dwarf, Mnon−massive corresponds to the least massive white dwarf. On the left model γα is used for the common envelope parametrisation, on the right model αα (see Sect. 3). The intensity of the grey scale corresponds to the density of objects on a linear scale in units of number of systems per 105 M⊙. To increase the contrast, we placed an upper limit on the intensity, which effects only one bin for model γα and two bins for model αα. The black solid line corresponds to a combined mass of 1.4 M⊙. The dashed and dashed-dotted line correspond to a mass ratio q = m/M of 1 and 0.8, respectively. The mass ratio distribution, which is important e.g. in the scenarios proposed by Pakmor et al. (2010) and van Kerkwijk et al. (2010) are very different for model γα and αα.
Current usage metrics show cumulative count of Article Views (full-text article views including HTML views, PDF and ePub downloads, according to the available data) and Abstracts Views on Vision4Press platform.
Data correspond to usage on the plateform after 2015. The current usage metrics is available 48-96 hours after online publication and is updated daily on week days.
Initial download of the metrics may take a while.