Fig. 8
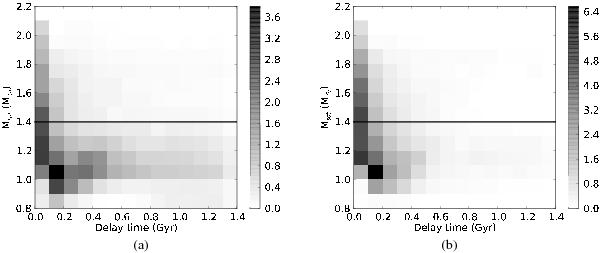
Simulated distribution of the population of merging double CO white dwarfs from a single burst of star formation as a function of delay time and total mass of the system. On the left model γα is used for the common envelope parametrisation, on the right model αα (see Sect. 3). The intensity of the grey scale corresponds to the density of objects on a linear scale in units of number of systems per 105 M⊙. The black line corresponds to a combined mass of 1.4 M⊙.
Current usage metrics show cumulative count of Article Views (full-text article views including HTML views, PDF and ePub downloads, according to the available data) and Abstracts Views on Vision4Press platform.
Data correspond to usage on the plateform after 2015. The current usage metrics is available 48-96 hours after online publication and is updated daily on week days.
Initial download of the metrics may take a while.