Fig. 3
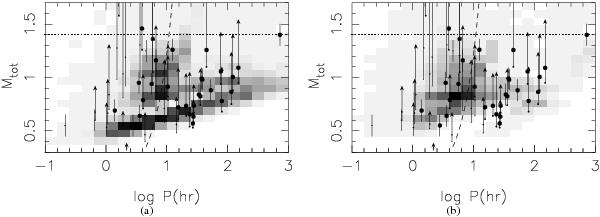
Simulated population of visible double white dwarfs as a function of orbital period and the combined mass of the two dwarfs. On the left the common envelope is parametrised according to model γα, on the right according to model αα (see Sect. 3). The intensity of the grey scale corresponds to the density of objects on a linear scale. The same grey scale is used for both plots. Observed binary white dwarfs are overplotted with filled circles, see Fig. 1 for references. The Chandrasekhar mass limit is indicated with the dotted line. The dashed line roughly demarks the region in which systems merge within a Hubble time. Systems located to the left of the dashed line and above the dotted line are supernova type Ia progenitors in the standard picture.
Current usage metrics show cumulative count of Article Views (full-text article views including HTML views, PDF and ePub downloads, according to the available data) and Abstracts Views on Vision4Press platform.
Data correspond to usage on the plateform after 2015. The current usage metrics is available 48-96 hours after online publication and is updated daily on week days.
Initial download of the metrics may take a while.