Fig. 1
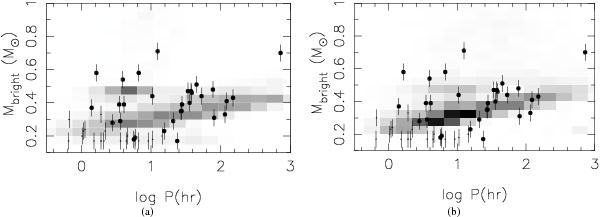
Simulated population of visible double white dwarfs as a function of orbital period and mass of the brighter white dwarf. Left: the stellar evolution tracks according to EFT are used; right: HPT (using model γα, see Sect. 3). The intensity of the grey scale corresponds to the density of objects on a linear scale. The same grey scale is used for both plots. Observed binary white dwarfs are overplotted with filled circles. Thick points taken are from Marsh et al. (2011), thinner points from Tovmassian et al. (2004); Napiwotzki et al. (2005); Kulkarni & van Kerkwijk (2010); Brown et al. (2010, 2011); Marsh et al. (2011); Kilic et al. (2011a,c,b), see Sect. 2.1 for a discussion.
Current usage metrics show cumulative count of Article Views (full-text article views including HTML views, PDF and ePub downloads, according to the available data) and Abstracts Views on Vision4Press platform.
Data correspond to usage on the plateform after 2015. The current usage metrics is available 48-96 hours after online publication and is updated daily on week days.
Initial download of the metrics may take a while.