Fig. 4
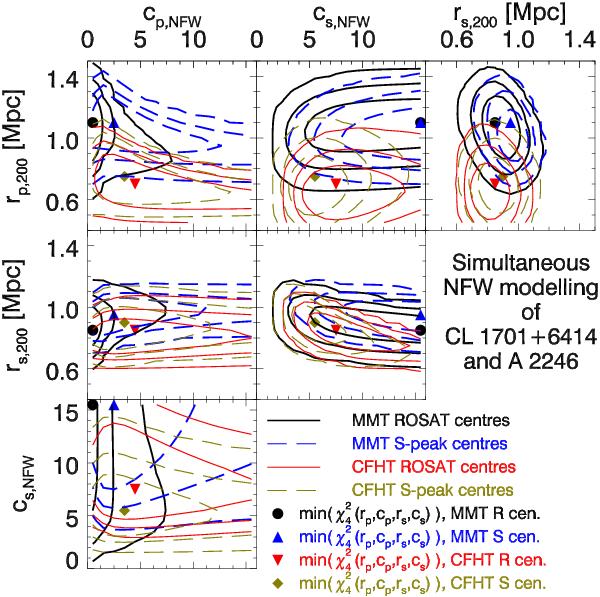
Simultaneous NFW modelling of CL 1701+6414 and A 2246. Each panel shows the
dependencies between two of the four parameters, with the other two marginalised.
Solid confidence contours (1σ, 2σ,
3σ) denote the default case, using the ROSAT centres; dashed
contours denote models centred on the S-peaks. The respective
parameters minimising  are
indicated by a filled circle and a upward triangle. Sets of thin contours denote the
confidence contours and parameters minimising
obtained from the analogous analysis of the CFHT lensing catalogue. The best-fit
values for the CFHT data are marked by downward- and upward-pointing triangles for
the ROSAT and S-peak centres, respectively.
are
indicated by a filled circle and a upward triangle. Sets of thin contours denote the
confidence contours and parameters minimising
obtained from the analogous analysis of the CFHT lensing catalogue. The best-fit
values for the CFHT data are marked by downward- and upward-pointing triangles for
the ROSAT and S-peak centres, respectively.
Current usage metrics show cumulative count of Article Views (full-text article views including HTML views, PDF and ePub downloads, according to the available data) and Abstracts Views on Vision4Press platform.
Data correspond to usage on the plateform after 2015. The current usage metrics is available 48-96 hours after online publication and is updated daily on week days.
Initial download of the metrics may take a while.