Fig. 3
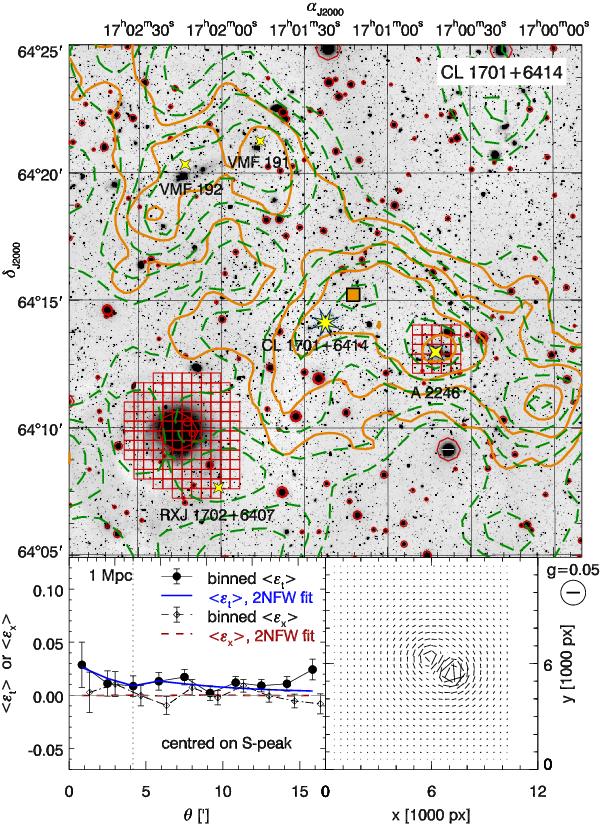
Shear signal in the CL 1701+6414 field and its best-fit model with two NFW components accounting for CL 1701+6414 and A 2246. Upper plot: the layout follows Fig. 2. The ROSAT position of A 2246 is marked by a big four-pointed star symbol. Smaller star symbols denote positions of further X-ray clusters. Lower left plot: the layout follows Fig. 2. The solid blue and dashed red lines give the mean tangential and cross shear components, averaged in bins around the CL 1701+6414 shear peak, as expected from the two-cluster model. The separation of the two main clusters is indicated by a vertical dotted line. Lower right plot: the orientations and amplitudes of the shear, as expected from the best-fit two-cluster model, calculated on a regular grid.
Current usage metrics show cumulative count of Article Views (full-text article views including HTML views, PDF and ePub downloads, according to the available data) and Abstracts Views on Vision4Press platform.
Data correspond to usage on the plateform after 2015. The current usage metrics is available 48-96 hours after online publication and is updated daily on week days.
Initial download of the metrics may take a while.