Fig. 2
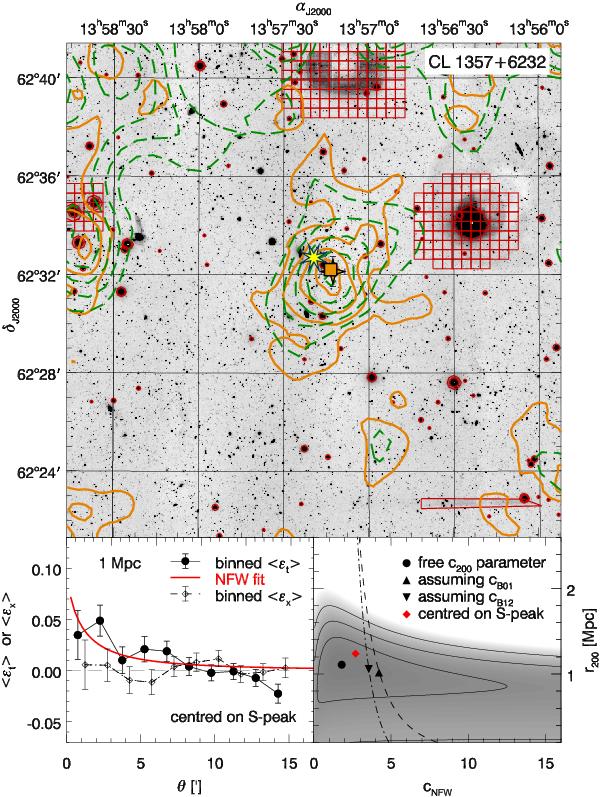
Lensing results for CL 1357+6232. Upper panel: MegaCam
r′-band image (cut-out of ~20′ side length), overlaid
with S-statistics (orange solid) and
 (green dashed) contours. Contours start at S = 1.0 and
 , with increments of
ΔS = 1.0 and
, with increments of
ΔS = 1.0 and  , respectively. The
eight-pointed star symbol marks the ROSAT cluster centre, while the filled square
shows the shear peak grid cell. A star symbol with error bars denotes the lensing
centre from bootstrapping. Regions inside red polygons are masked out of the analysis.
Lower left panel: profiles of the binned tangential
(⟨ εt⟩, filled circles) and binned cross
(⟨ ε × ⟩, open diamonds) ellipticities. Error bars
give the bin dispersions. The thick blue curve denotes the best-fit NFW model
(Eq. (3)). Here, the
S-peak was assumed as centre. Lower right panel:
Δχ2(r200,cNFW)
with respect to its minimum (filled circle), shown as grey shading and contours
indicating 1σ, 2σ, and 3σ
confidence. An upward (downward) triangle on a dashed (dash-dotted) curves mark the
best-fit values assuming the B01 and B12
mass-c200-relations. A diamond marks cluster parameters
assuming the S-peak as centre.
, respectively. The
eight-pointed star symbol marks the ROSAT cluster centre, while the filled square
shows the shear peak grid cell. A star symbol with error bars denotes the lensing
centre from bootstrapping. Regions inside red polygons are masked out of the analysis.
Lower left panel: profiles of the binned tangential
(⟨ εt⟩, filled circles) and binned cross
(⟨ ε × ⟩, open diamonds) ellipticities. Error bars
give the bin dispersions. The thick blue curve denotes the best-fit NFW model
(Eq. (3)). Here, the
S-peak was assumed as centre. Lower right panel:
Δχ2(r200,cNFW)
with respect to its minimum (filled circle), shown as grey shading and contours
indicating 1σ, 2σ, and 3σ
confidence. An upward (downward) triangle on a dashed (dash-dotted) curves mark the
best-fit values assuming the B01 and B12
mass-c200-relations. A diamond marks cluster parameters
assuming the S-peak as centre.
Current usage metrics show cumulative count of Article Views (full-text article views including HTML views, PDF and ePub downloads, according to the available data) and Abstracts Views on Vision4Press platform.
Data correspond to usage on the plateform after 2015. The current usage metrics is available 48-96 hours after online publication and is updated daily on week days.
Initial download of the metrics may take a while.