Free Access
Fig. 8
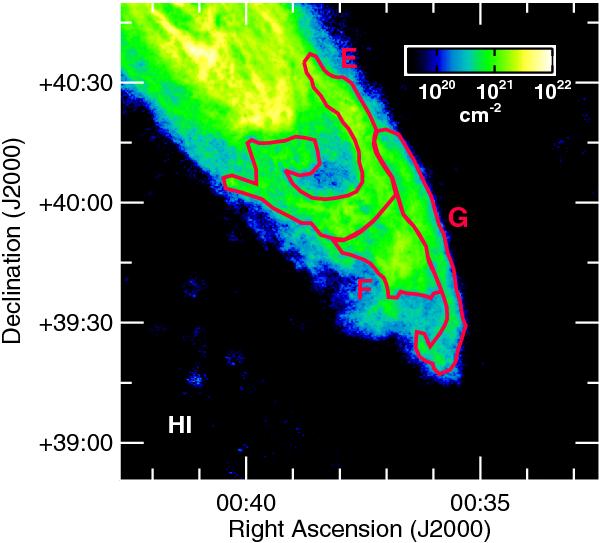
Zoom on the outermost part of the south-west region in the high resolution H i map. Overlapped are the contours defining the three outermost regions (see text for details on the selection on these regions).
Current usage metrics show cumulative count of Article Views (full-text article views including HTML views, PDF and ePub downloads, according to the available data) and Abstracts Views on Vision4Press platform.
Data correspond to usage on the plateform after 2015. The current usage metrics is available 48-96 hours after online publication and is updated daily on week days.
Initial download of the metrics may take a while.