Fig. 6
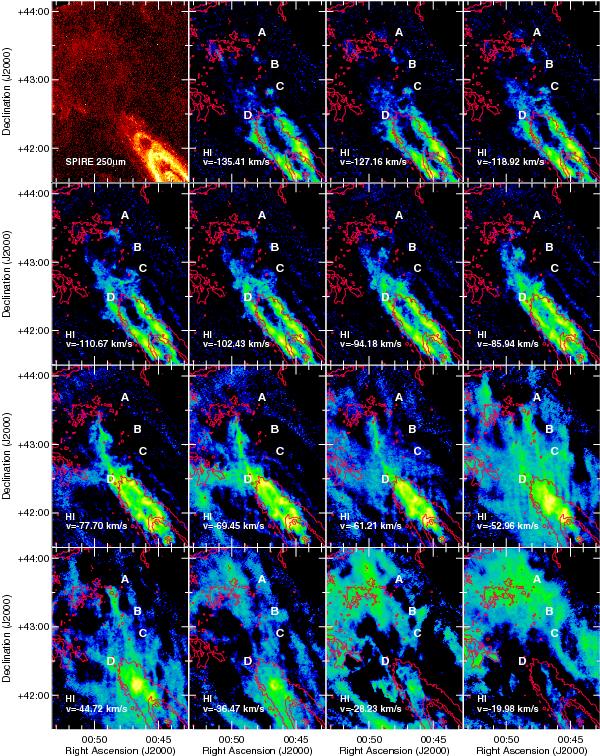
Zoom of the north-east edge of M 31. The top left panel shows part of the Herschel 250 μm image as a colour map, while the same image is shown as contour in the other panels (contours are 3 mJy beam-1, i.e. ~3.8σ, 30 mJy beam-1, and 300 mJy beam-1), superimposed to the H i map at various velocities. The channel velocities are indicated in the bottom left corner of each panel. Structures in the IR identified as A to D (see also Figs. 1 and 5) are indicated in the panels. The other panels show the SPIRE 250 μm image as contours and channel maps from the high-resolution H i datacube as colour map.
Current usage metrics show cumulative count of Article Views (full-text article views including HTML views, PDF and ePub downloads, according to the available data) and Abstracts Views on Vision4Press platform.
Data correspond to usage on the plateform after 2015. The current usage metrics is available 48-96 hours after online publication and is updated daily on week days.
Initial download of the metrics may take a while.