Free Access
Fig. 4
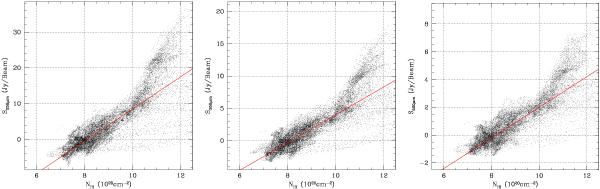
Pixel-by-pixel correlation between H i column density, derived from the full H i integral M 31 image at low resolution, and the flux at 250, 350 and 500 μm from left to right, respectively. The red lines represent a linear fit to the data.
This figure is made of several images, please see below:
Current usage metrics show cumulative count of Article Views (full-text article views including HTML views, PDF and ePub downloads, according to the available data) and Abstracts Views on Vision4Press platform.
Data correspond to usage on the plateform after 2015. The current usage metrics is available 48-96 hours after online publication and is updated daily on week days.
Initial download of the metrics may take a while.