Fig. 1
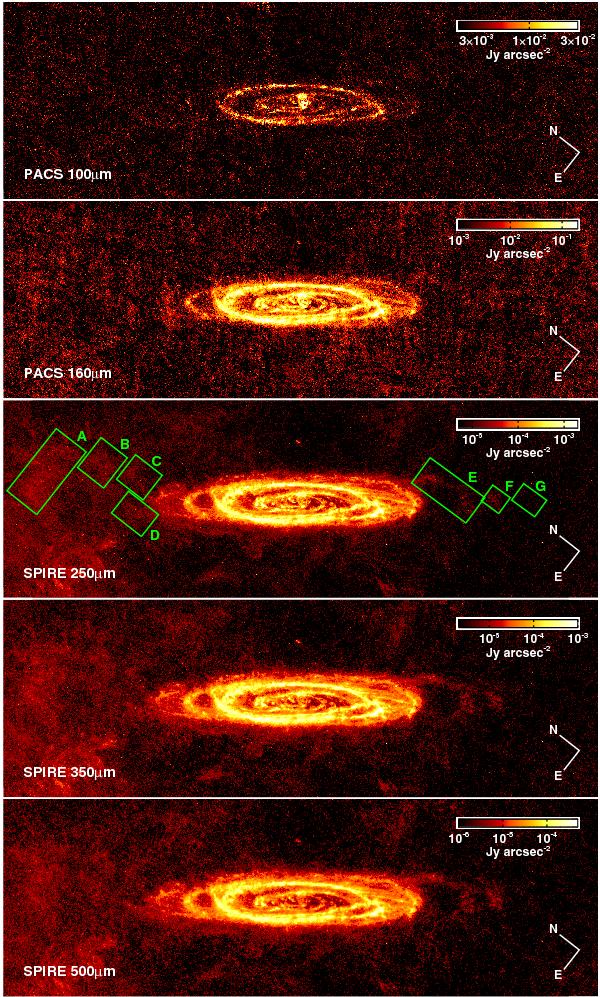
Images in the five Herschel bands (from top to bottom: PACS 100 and 160 μm, SPIRE 250, 350 and 500 μm). These are the original images, where no correction for the foreground cirrus was applied (see Sect. 4.1). The green rectangles in the 250 μm map represent tentative detections of dust in the outskirts (see discussion in Sect. 4.2). The directional axes length corresponds to 15′ (~3.42 kpc).
Current usage metrics show cumulative count of Article Views (full-text article views including HTML views, PDF and ePub downloads, according to the available data) and Abstracts Views on Vision4Press platform.
Data correspond to usage on the plateform after 2015. The current usage metrics is available 48-96 hours after online publication and is updated daily on week days.
Initial download of the metrics may take a while.