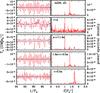
Fig. 7
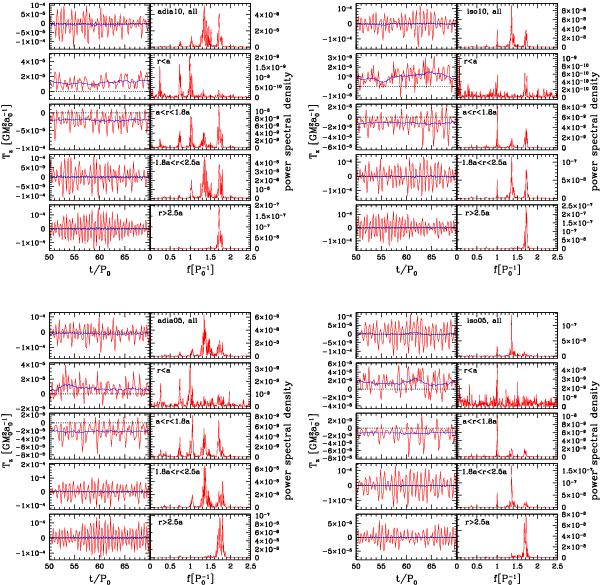
Each plot depicts the torques exerted by the disc on the BHB in the time domain (left panels) and in the frequency domain (right panels). In each plot, from the top to the bottom, pairs of panels refer to the five domains discussed in the text: total torque (i), torque exerted by the material located at r < a (ii), a < r < 1.8a (iii), 1.8a < r < 2.5a (iv) and r > 2.5a (v). In each left panel, the red line is the raw oscillating torque, and the blue one is the torque smoothed over three periods to show the average behaviour. In the associated right panel, we plot the power spectrum as a function of frequency in units of the initial binary orbital frequency. All torques strongly oscillate, showing several characteristic frequencies, however, note the different scales of the panels.
Current usage metrics show cumulative count of Article Views (full-text article views including HTML views, PDF and ePub downloads, according to the available data) and Abstracts Views on Vision4Press platform.
Data correspond to usage on the plateform after 2015. The current usage metrics is available 48-96 hours after online publication and is updated daily on week days.
Initial download of the metrics may take a while.