Fig. 4
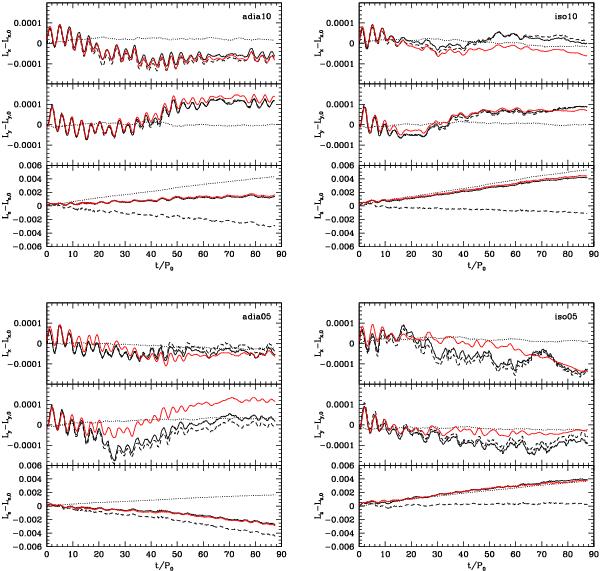
Consistency check of the evolution of the binary angular momentum components for all the simulations. In each plot, the Lx, Ly and Lz component evolution is shown from the top to the bottom. In each panel, the dashed line is the ΔL exchange balancing the gravity torques at each time step, the dotted line is the ΔL exchange computed from the accreted particles, and the solid black line is the sum of those two. For comparison, the red line is the angular momentum evolution taken directly from the raw simulation data. All ΔL are in units of [M0a0Vc,0] .

Current usage metrics show cumulative count of Article Views (full-text article views including HTML views, PDF and ePub downloads, according to the available data) and Abstracts Views on Vision4Press platform.
Data correspond to usage on the plateform after 2015. The current usage metrics is available 48-96 hours after online publication and is updated daily on week days.
Initial download of the metrics may take a while.