Fig. 3
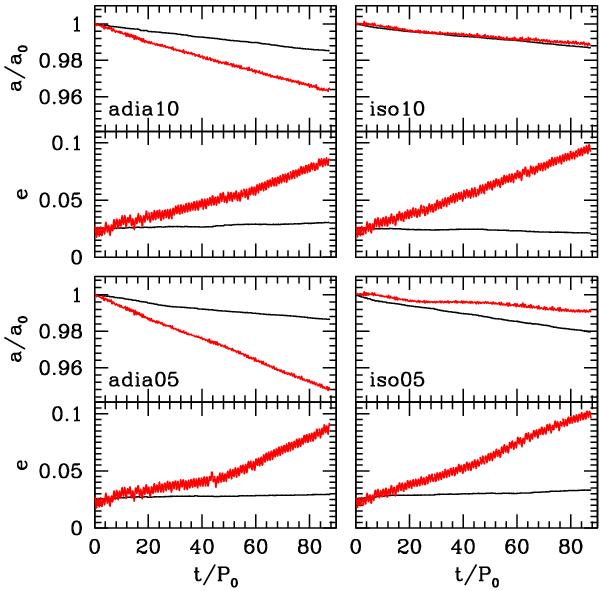
Semimajor axis (top panel in each plot) and eccentricity (bottom panel in each plot) evolution for all the four runs. In each panel, the red line represents the full evolution directly taken from the simulation whereas the black line is the equivalent evolution when considering the energy and angular momentum exchanges due to accreted particles only (i.e., basically due the evolution of the mass and mass ratio of the binary).
Current usage metrics show cumulative count of Article Views (full-text article views including HTML views, PDF and ePub downloads, according to the available data) and Abstracts Views on Vision4Press platform.
Data correspond to usage on the plateform after 2015. The current usage metrics is available 48-96 hours after online publication and is updated daily on week days.
Initial download of the metrics may take a while.