Fig. 11
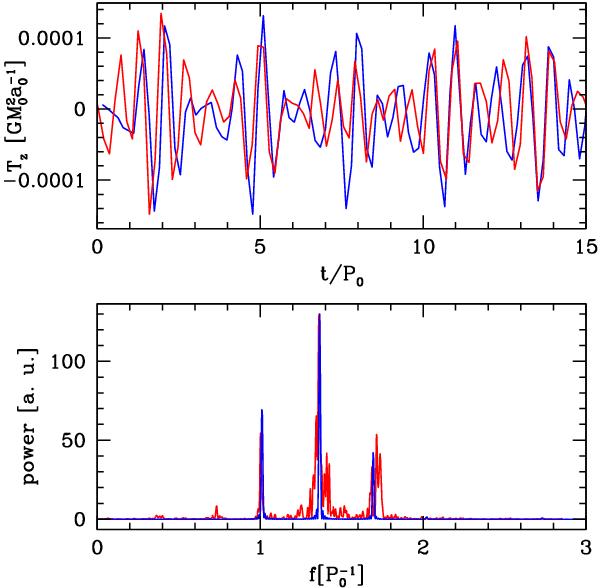
Simple test model for the periodicity generated in the outside disc, i.e. at r > a. In the top panel we show the temporal evolution of the torque, whereas in the bottom panel we show the Fourier transform. In each panel, the blue curve is obtained by placing three point masses at distance 1.6a, 2.1a, 3.5a from a circular binary, and the one red is the torque found in the iso10 simulation.
Current usage metrics show cumulative count of Article Views (full-text article views including HTML views, PDF and ePub downloads, according to the available data) and Abstracts Views on Vision4Press platform.
Data correspond to usage on the plateform after 2015. The current usage metrics is available 48-96 hours after online publication and is updated daily on week days.
Initial download of the metrics may take a while.