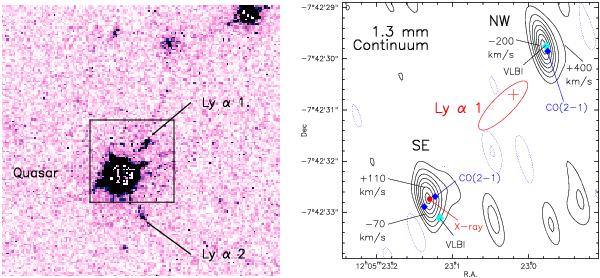
Fig.6

HST image and 1.3 mm dust continuum map. Left: HST F814W image of the BR1202–0725 region (Hu et al. 1996) showing the quasar and the two galaxies with Ly-α redshifts measured by Hu et al. (1996, 1997). In this filter, the two Ly-α galaxies appear only in the starlight continuum, not the Ly-α line. The field is 16.4″ × 16.4″. The smaller box shows the 5″ × 5″ field of the 1.3 mm continuum map at the right. Right: contours show the BR1202-0725 dust continuum at 1.3 mm in steps of 0.26 mJy/beam (1.5σ); negative contours are dashed, beam = 0.85″ × 0.26″. Next to the NW and SE galaxies separated by 3.7″ are labels indicating the CO(5–4) velocity components discussed in the text, with offsets (km s-1) relative to 101.190 GHz (z = 4.6949). The Ly-α-1 object, near the NW galaxy, is indicated by an ellipse. The cross in the ellipse marks the optical continuum peak, 2.6″ from the quasar (Hu et al. 1996, 1997). The Ly-α peak is near the southern part of the ellipse, 2.3″ from the quasar (Hu et al. 1996; Fontana et al. 1998; Ohyama et al. 2004). In the visible and near-IR, there is also a string of starlight continuum emission extending over 4″ in the same direction, but displaced by 0.6″ from the Ly-α-1 object (Hu et al. 1996; Fontana et al. 1998; Ohyama et al. 2004). In the SE galaxy (lower left) the central dot indicates the X-ray source, coincident with the quasar (Evans et al. 2010). The other dots show the VLA CO(2–1) peaks on either side of the quasar, and in the NW galaxy (Carilli et al. 2002). The pale diamonds show the extended non-thermal emission observed in VLBI at 1.4 GHz (Momjian et al. 2005). Source positions are listed in Table 1.
Current usage metrics show cumulative count of Article Views (full-text article views including HTML views, PDF and ePub downloads, according to the available data) and Abstracts Views on Vision4Press platform.
Data correspond to usage on the plateform after 2015. The current usage metrics is available 48-96 hours after online publication and is updated daily on week days.
Initial download of the metrics may take a while.


