Fig. 16
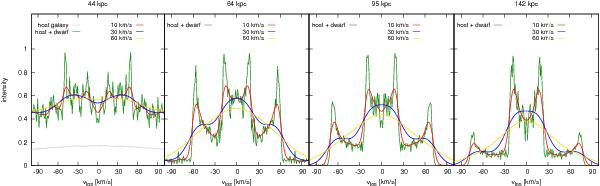
Line profiles of four shells at projected radii 0.9rs (indicated as the title of each plot, same as in Fig. 12) 2.2 Gyr after the decay of the cannibalized galaxy: gray lines show the LOSVDs for the host galaxy at a given radius (except for the radius of 44 kpc the signal of the host galaxy is negligible comparing to the signal from the cannibalized galaxy); green lines show the total LOSVDs from the host and the cannibalized galaxy together; red, blue, and yellow lines show convolutions of the total simulated data with different Gaussians representing the instrumental profiles having the FWHM 10, 30, and 60 km s-1, respectively. Scaling is relative, similar as in Fig. 12.
Current usage metrics show cumulative count of Article Views (full-text article views including HTML views, PDF and ePub downloads, according to the available data) and Abstracts Views on Vision4Press platform.
Data correspond to usage on the plateform after 2015. The current usage metrics is available 48-96 hours after online publication and is updated daily on week days.
Initial download of the metrics may take a while.