Fig. 10
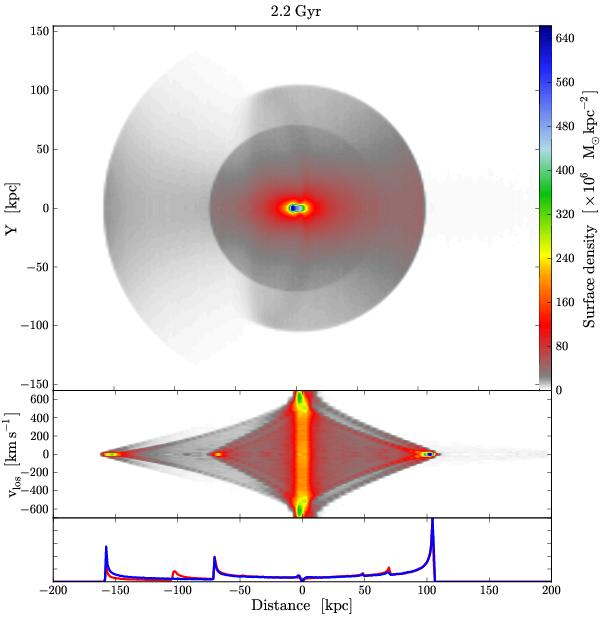
Simulated shell structure 2.2 Gyr after the decay of the cannibalized galaxy. Only the particles originally belonging to the cannibalized galaxy are taken into account. Top: surface density map; middle: the LOSVD density map of particles in the ± 1 kpc band around the collision axis; bottom: histogram of galactocentric distances of particles. The angle between the radial position vector of the particle and the x-axis (the collision axis) is less than 90° for the blue curve and less than 45° for the red curve. The horizontal axis corresponds to the projected distance X in the upper panel, to the projected radius R in the middle panel, and to the galactocentric distance r in the lower panel.
Current usage metrics show cumulative count of Article Views (full-text article views including HTML views, PDF and ePub downloads, according to the available data) and Abstracts Views on Vision4Press platform.
Data correspond to usage on the plateform after 2015. The current usage metrics is available 48-96 hours after online publication and is updated daily on week days.
Initial download of the metrics may take a while.