Fig. 2
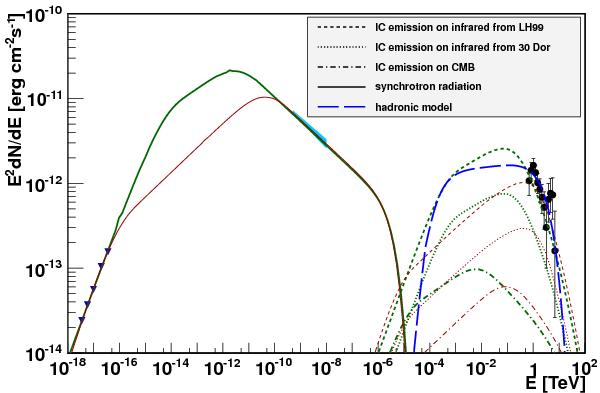
Spectral energy distribution of N 157B. The data shown are radio emission (Lazendic et al. 2000, blue triangles), non-thermal X-rays (Chen et al. 2006, blue band), and TeV gamma rays (H.E.S.S., this work, black circles). The green, thick lines represent the model with a cooling break depending on the magnetic field and the age of the remnant. The red, thin lines denote the conservative model that minimises the energy content of electrons. The blue, long-dashed line represents a hadronic scenario.
Current usage metrics show cumulative count of Article Views (full-text article views including HTML views, PDF and ePub downloads, according to the available data) and Abstracts Views on Vision4Press platform.
Data correspond to usage on the plateform after 2015. The current usage metrics is available 48-96 hours after online publication and is updated daily on week days.
Initial download of the metrics may take a while.