Fig. 1
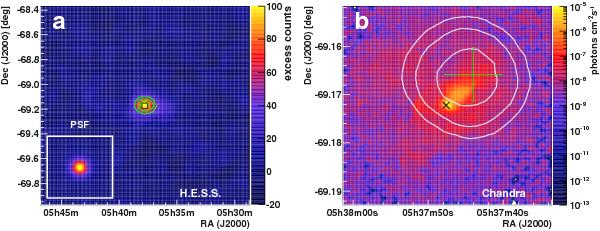
Gamma-ray and X-ray view of N 157B. a) Image of the TeV gamma-ray excess obtained with H.E.S.S. The image was smoothed with the instrument’s point-spread function, which is shown in the inset. The green contour lines denote 6, 9, and 12σ statistical significances. The black box outlines the region shown in the X-ray image. b) Image of the X-ray flux in the energy band from 0.8 keV to 8 keV (Chandra ACIS-S, observation no. 2783, 48.2 ks dead-time corrected exposure). The data were smoothed with a Gaussian of σ = 1.5″ and the exposure map was computed with an assumed spectral index of 2.3, which is the average index of the nebula. The colour coding represents the X-ray flux in photons cm-2 s -1; for better visibility, it is clipped at 10-13 photons cm-2 s-1 at the lower end and saturates at 10-5 photons cm-2 s-1. The white contour lines denote regions of 68%, 95%, and 99% confidence for the position of the gamma-ray source HESS J0537 − 691. The position of the pulsar PSR J0537 − 6910 is indicated by a black cross. The green cross marks the best-fit position and the systematic uncertainty in the pointing of the H.E.S.S. telescopes.
Current usage metrics show cumulative count of Article Views (full-text article views including HTML views, PDF and ePub downloads, according to the available data) and Abstracts Views on Vision4Press platform.
Data correspond to usage on the plateform after 2015. The current usage metrics is available 48-96 hours after online publication and is updated daily on week days.
Initial download of the metrics may take a while.