Fig. 4
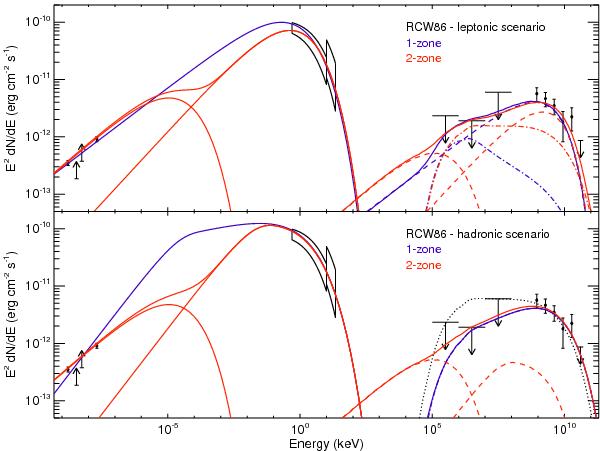
Spectral energy distribution of RCW 86 with the best-fit leptonic
(top) and hadronic (bottom) models. The radio
data points are from Molonglo at 408 MHz and Parkes at 5 GHz (Caswell et al. 1975; Green 2011, priv. comm.), and lower limits
from MOST at 843 MHz and ATCA at 1.43 GHz (Whiteoak
& Green 1996; Dickel et al.
2001). X-ray spectra from ASCA and RXTE were obtained as described in
Sect. 3. The Fermi-LAT upper
limits (99.9% C.L.) derived in Sect. 2.2 and
the H.E.S.S. data points in the VHE domain (Aharonian
et al. 2009) are also shown. For each plot, the blue (respectively red)
lines denote the total broadband emission from the one-zone (respectively two-zone)
modeling discussed in Sect. 4, with SC, IC
(with CMB only) and π0 spectra shown as solid, dashed,
and dash-dotted lines, respectively. The associated best-fit parameters are provided
in Table 2. Note that in the bottom panel,
π0 emission is similar for the two models, and equals
the total gamma-ray emission in the one-zone model (solid blue line). In addition,
the dotted black line shows the (excluded) case of π0
emission from a E-2 hadron spectrum with
 /
/ and Emax,p = 100 TeV.
Current usage metrics show cumulative count of Article Views (full-text article views including HTML views, PDF and ePub downloads, according to the available data) and Abstracts Views on Vision4Press platform.
Data correspond to usage on the plateform after 2015. The current usage metrics is available 48-96 hours after online publication and is updated daily on week days.
Initial download of the metrics may take a while.