Fig. 3
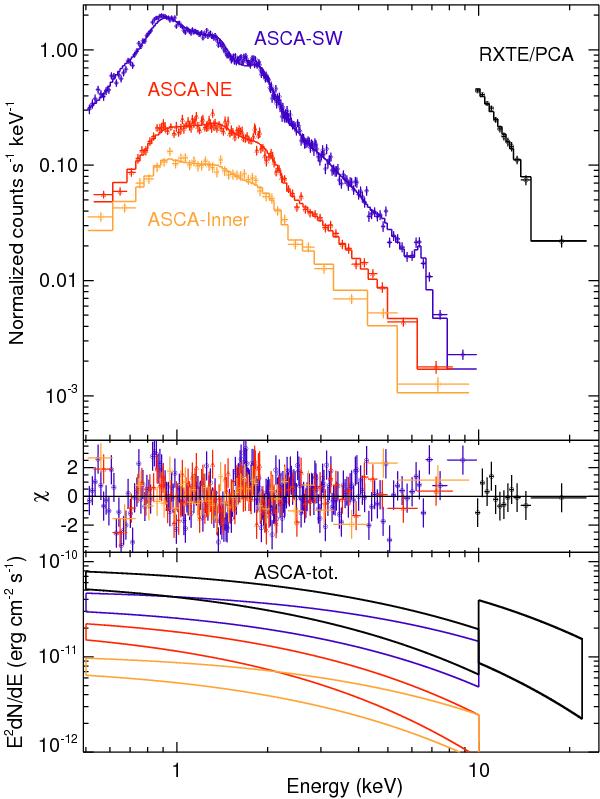
0.5–10 keV ASCA/GIS spectra from the three regions considered in this work, together with the RXTE/PCA spectrum in the 10–25 keV energy range. All spectra have been rebinned to 10σ per bin for sake of clarity. Solid lines represent the best-fit models (see text and Table 1). Residuals and unfolded nonthermal spectra are shown in the middle and lower panels, respectively.
Current usage metrics show cumulative count of Article Views (full-text article views including HTML views, PDF and ePub downloads, according to the available data) and Abstracts Views on Vision4Press platform.
Data correspond to usage on the plateform after 2015. The current usage metrics is available 48-96 hours after online publication and is updated daily on week days.
Initial download of the metrics may take a while.