Fig. 4
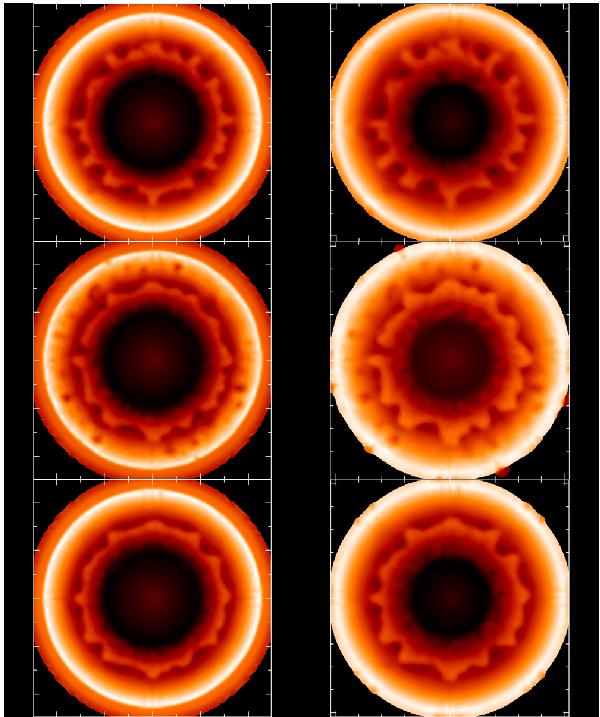
Density color map depicting the growth of the RT instability in a SNR for models B1 (upper panels), B2 (middle panels), and B3 (lower panels) of Table 1 at times t = 698 yr (left columns) and t = 951 yr (right columns). The size of the box in all panels is 10 pc in each direction.
Current usage metrics show cumulative count of Article Views (full-text article views including HTML views, PDF and ePub downloads, according to the available data) and Abstracts Views on Vision4Press platform.
Data correspond to usage on the plateform after 2015. The current usage metrics is available 48-96 hours after online publication and is updated daily on week days.
Initial download of the metrics may take a while.