Fig. 1
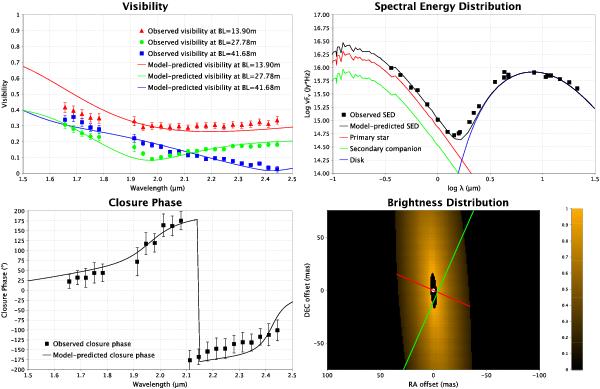
Observations and temperature-gradient model (i = 80°) of MWC 300. The upper-left panel shows the observed visibilities and the visibilities of the best-fitting model; lower-left the model-predicted and observed closure phases, upper-right the different lines refer to the SED contributions from different components of our model. Black dots are the observed data. The lower-right panel shows the logarithm of brightness distribution of the model disk. North is up and east to the left. The white point represents the location of the primary star. Our observations were performed along the PA of 66.2° (red line). The green line refers to the possible locations of the secondary companion.
Current usage metrics show cumulative count of Article Views (full-text article views including HTML views, PDF and ePub downloads, according to the available data) and Abstracts Views on Vision4Press platform.
Data correspond to usage on the plateform after 2015. The current usage metrics is available 48-96 hours after online publication and is updated daily on week days.
Initial download of the metrics may take a while.