Free Access
Fig. 2
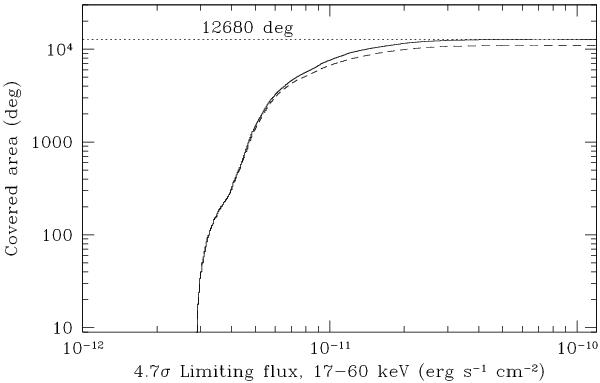
Sky area as a function of the limiting flux for source detection with a 4.7σ significance (solid line). The black dashed curve shows the sky coverage with the masked area around bright sources listed in Table 1. The dotted line represents the geometrical area.
Current usage metrics show cumulative count of Article Views (full-text article views including HTML views, PDF and ePub downloads, according to the available data) and Abstracts Views on Vision4Press platform.
Data correspond to usage on the plateform after 2015. The current usage metrics is available 48-96 hours after online publication and is updated daily on week days.
Initial download of the metrics may take a while.