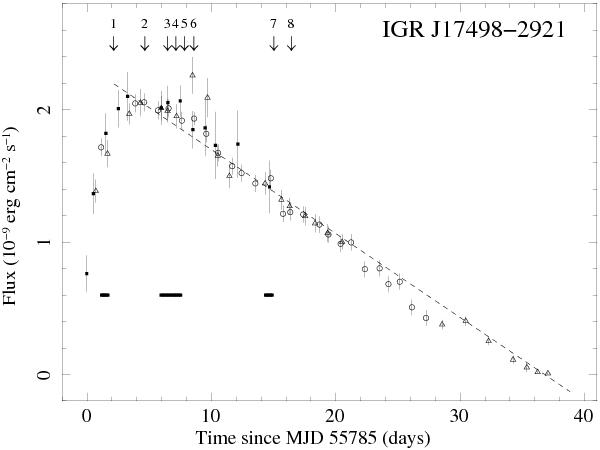
Fig. 2

RXTE/PCA (open circles), Swift/XRT (open triangles), and INTEGRAL/ISGRI (filled squares) outburst lightcurve of IGR J17498–2921. For plotting purpose, we chose a time bin of one day. The count rate was converted into flux (0.1–300 keV) using the spectral results reported in Sect. 3.1. The arrows indicate the times of the detected X-ray bursts (see Table 2). The dashed lined correspond to the best-fit linear decay F-9 = −0.64 tday ± 0.09. The three horizontal bars correspond to the time intervals of our spectral results reported in Table 1.
Current usage metrics show cumulative count of Article Views (full-text article views including HTML views, PDF and ePub downloads, according to the available data) and Abstracts Views on Vision4Press platform.
Data correspond to usage on the plateform after 2015. The current usage metrics is available 48-96 hours after online publication and is updated daily on week days.
Initial download of the metrics may take a while.


