Fig. 6
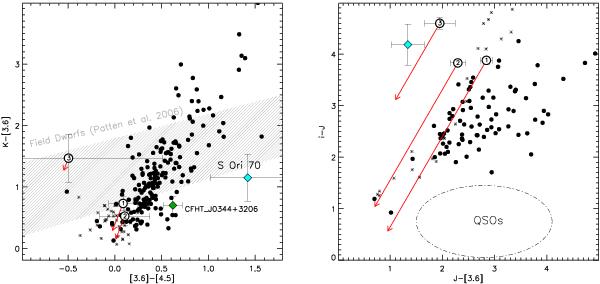
Left panel: KS − [3.6] vs. [3.6]−[4.5] color–color diagram. The circles with error bars are our the T-dwarf candidates; their ID number (see Tables 3, 4) is indicated and the arrows indicate their position after correction for interstellar reddening. The Serpens Core class II (black dots) and class III (asterisks) YSO population, the S Ori 70 mid-T dwarf (sky-blue diamond), the CFHT_J0344+3206 mid-T dwarf candidate (green diamond) and the field dwarf sequence from Patten et al. (2006) (line-filled area) are plotted for comparison. Righ panel: i − J vs. J − [3.6] color–color diagram. Symbols are as in the left panel. The dot-dashed ellipse marks the area occupied by QSOs in the SWIRE catalog (Hatziminaoglou et al. 2008).
Current usage metrics show cumulative count of Article Views (full-text article views including HTML views, PDF and ePub downloads, according to the available data) and Abstracts Views on Vision4Press platform.
Data correspond to usage on the plateform after 2015. The current usage metrics is available 48-96 hours after online publication and is updated daily on week days.
Initial download of the metrics may take a while.