Fig. 4
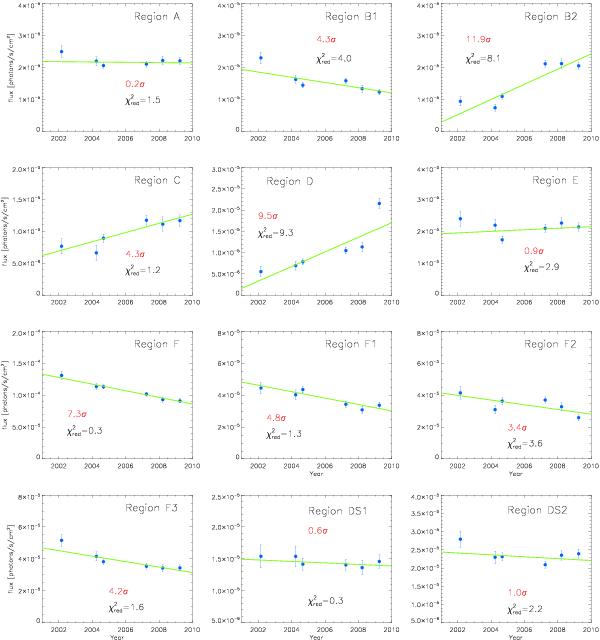
Lightcurves of the Fe-Kα flux from the filaments in the GC. The flux is plotted in units of 10-5 photons cm-2 s-1. The green line represents the best fit linear function to the data, whose parameters are reported in Table 4. In each panel we present the significance of the measured gradient (B/σB) together with the  for the best fit linear function.
Current usage metrics show cumulative count of Article Views (full-text article views including HTML views, PDF and ePub downloads, according to the available data) and Abstracts Views on Vision4Press platform.
Data correspond to usage on the plateform after 2015. The current usage metrics is available 48-96 hours after online publication and is updated daily on week days.
Initial download of the metrics may take a while.