Fig. 2
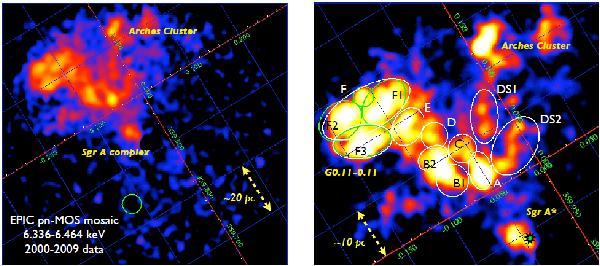
Left panel: fluence map (6.336–6.464 keV) of the Fe-Kα emission from the filaments in the GC. The image has been smoothed with a 8-pixel diameter top-hat filter. The grid lines define the Galactic coordinate frame, where the green circle shows the background region selected for the spectral analysis of the clouds marked in the right panel (Sect. 3.3). Right panel: a zoom-in on the region of the bright filaments. The white (green) ellipses show the regions (sub-regions) selected for the spectral analysis (see Table 2); region B has been divided into two subregions B1 and B2; region F (G0.11-0.11) into three subregions, F1 (ellipse plus small circle), F2 and F3. The position of Sgr A* is marked by a green star at l = −0.056 deg and b = −0.046 deg.
Current usage metrics show cumulative count of Article Views (full-text article views including HTML views, PDF and ePub downloads, according to the available data) and Abstracts Views on Vision4Press platform.
Data correspond to usage on the plateform after 2015. The current usage metrics is available 48-96 hours after online publication and is updated daily on week days.
Initial download of the metrics may take a while.