Fig. 5
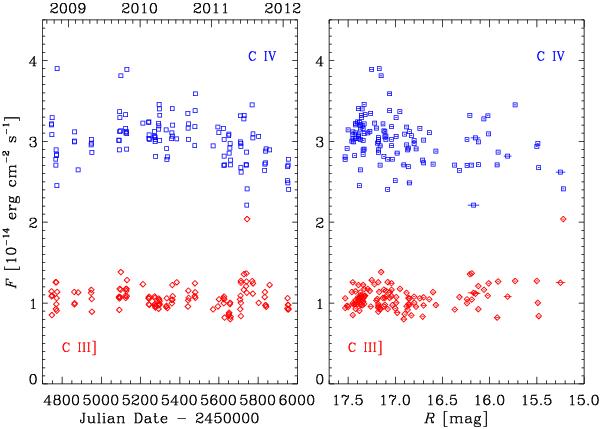
The flux in the observed frame of the C IV (blue squares) and C III] (red diamonds) emission lines as a function of time (left panel) and source brightness (right panel). During the period of monitoring, there is little evidence of significant emission-line variability in 4C 38.41. Data are derived from the ongoing monitoring programme at Steward Observatory.
Current usage metrics show cumulative count of Article Views (full-text article views including HTML views, PDF and ePub downloads, according to the available data) and Abstracts Views on Vision4Press platform.
Data correspond to usage on the plateform after 2015. The current usage metrics is available 48-96 hours after online publication and is updated daily on week days.
Initial download of the metrics may take a while.