Fig. 21
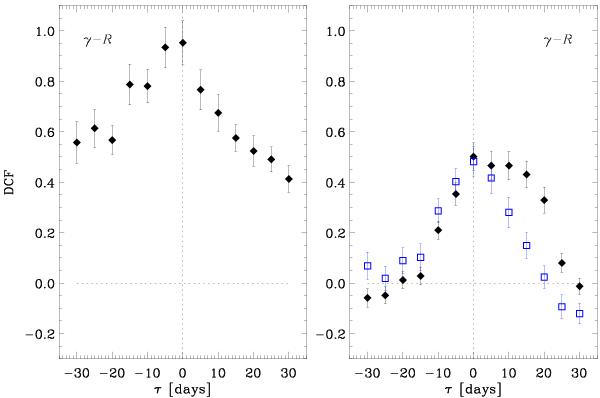
Discrete correlation function between the daily γ-ray flux and R-band flux density light curves shown in Fig. 16 before (left) and after (right) JD = 2 455 450 for a comparison with the Jorstad et al. (2011) results (see the text). The blue squares represent the case where the light curves are stopped at JD = 2 455 763 to avoid the influence of the optical flare without any significant γ-ray counterpart at JD ~ 2 455 767.
Current usage metrics show cumulative count of Article Views (full-text article views including HTML views, PDF and ePub downloads, according to the available data) and Abstracts Views on Vision4Press platform.
Data correspond to usage on the plateform after 2015. The current usage metrics is available 48-96 hours after online publication and is updated daily on week days.
Initial download of the metrics may take a while.