Fig. 2
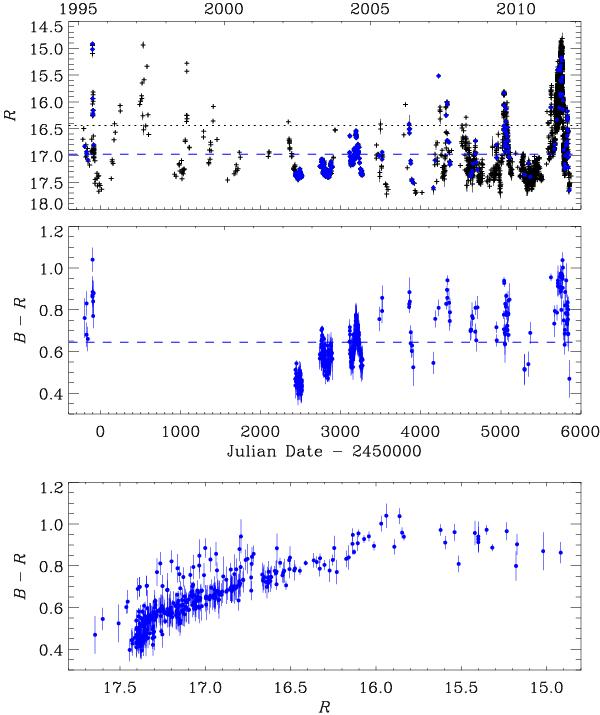
The R-band light curve of 4C 38.41 in 1995–2011 (top panel). Blue dots indicate the data used to derive the B − R colour indices shown both as a function of time (middle panel) and as a function of magnitude (bottom panel). The black dotted and blue dashed lines in the top panel indicate the average magnitude for the whole dataset and the data used for the colour indices, respectively. In the middle panel, the blue dashed line marks the average colour index.
Current usage metrics show cumulative count of Article Views (full-text article views including HTML views, PDF and ePub downloads, according to the available data) and Abstracts Views on Vision4Press platform.
Data correspond to usage on the plateform after 2015. The current usage metrics is available 48-96 hours after online publication and is updated daily on week days.
Initial download of the metrics may take a while.