Fig. 16
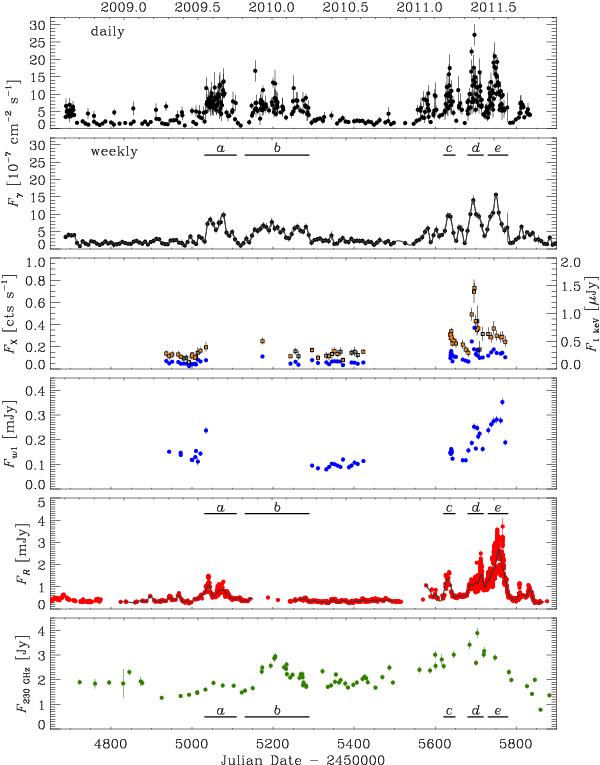
Light curves of 4C 38.41 at different frequencies in 2008–2011. From top to bottom: 1) the daily γ-ray light curve from Fermi-LAT in the 100 MeV–300 GeV range (10-7 ph cm-2 s-1); 2) the corresponding weekly γ-ray light curve with its cubic spline interpolation; 3) the X-ray light curve from Swift-XRT, derived as explained in Sect. 5.2; blue dots are counts s-1, while black squares represent 1 keV de-absorbed fluxes (μJy), which are filled in orange when resulting from robust spectral fits; 4) the de-absorbed Swift-UVOT flux density light curve in the uvw1 band (mJy); 5) the de-absorbed GASP R-band flux-density light curve (mJy) with the cubic spline interpolation through the 7-day binned data; 6) the millimetre radio light curve at 230 GHz (Jy).
Current usage metrics show cumulative count of Article Views (full-text article views including HTML views, PDF and ePub downloads, according to the available data) and Abstracts Views on Vision4Press platform.
Data correspond to usage on the plateform after 2015. The current usage metrics is available 48-96 hours after online publication and is updated daily on week days.
Initial download of the metrics may take a while.