Fig. 12
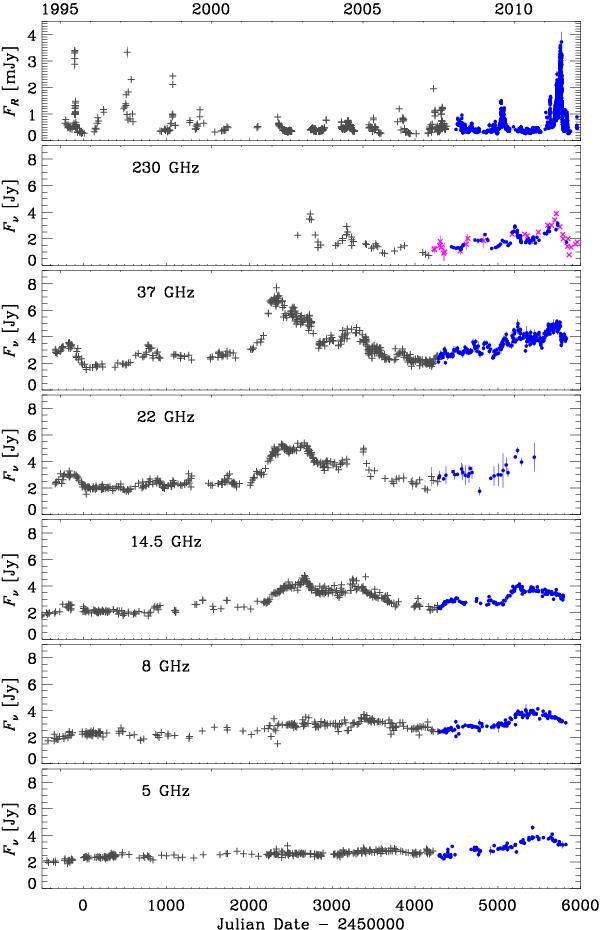
R-band optical flux densities (top) compared to the radio light curves at different frequencies in 1994–2011. Blue dots refer to data collected in the ambit of the GASP project, complemented by 230 GHz data from the IRAM 30 m telescope (purple crosses). Black plus sign symbols are historical data taken from the participating observatories’ archives and from the literature (see text for details).
Current usage metrics show cumulative count of Article Views (full-text article views including HTML views, PDF and ePub downloads, according to the available data) and Abstracts Views on Vision4Press platform.
Data correspond to usage on the plateform after 2015. The current usage metrics is available 48-96 hours after online publication and is updated daily on week days.
Initial download of the metrics may take a while.